- Startseite >
- Messwerte >
- Grundwasser >
- Karte: Unterer Main >
- Limbach Q1 >
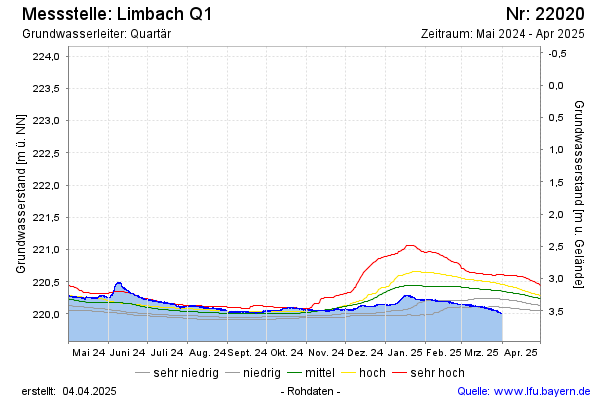
- Diagramm Messwerte
Station Limbach Q1
Hinweis: Datendownload siehe Internetangebot Gewässerkundlicher Dienst.
| Datum Zeit | Grundwasserstand [m ü. NN] | Grundwasserstand [m u. Gelände] |
|---|---|---|
| 01.07.2026 11:00 | 219,96 | 3,56 |
| 01.07.2026 10:00 | 219,97 | 3,55 |
| 01.07.2026 09:00 | 219,97 | 3,55 |
Letzte Datenaktualisierung: Mittwoch 01. Juli 2026, 16:07 Uhr
© Bayerisches Landesamt für Umwelt 2026